
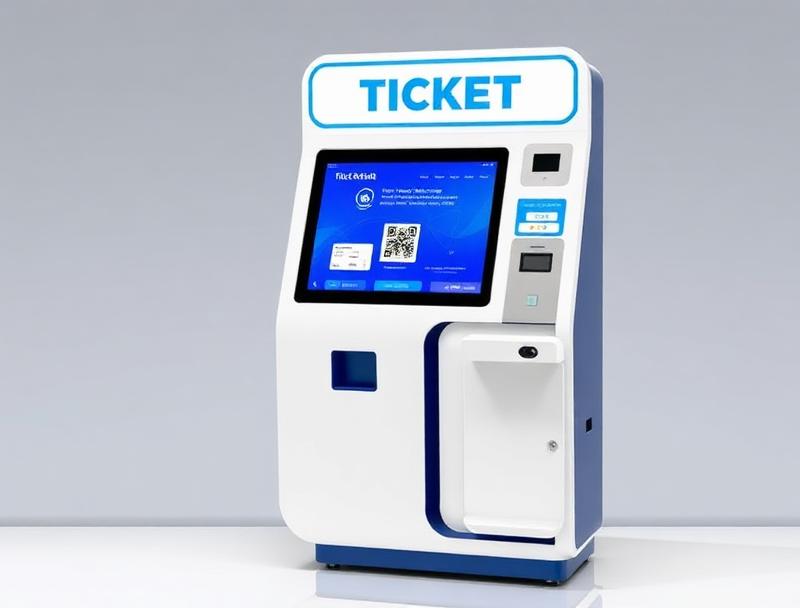
Selling or booking every place does not mean everyone will attend. Combining ticketing history with confirmations and QR scans helps estimate real attendance and prepare each service more accurately.
Event attendance forecasting cannot rely on tickets sold alone. Invitations, free bookings, passes and last-minute changes create a gap between committed capacity and the people who actually enter.
By connecting ticketing, communications and QR scans, organisers can build sensible scenarios, adjust resources and learn from every edition without treating an estimate as a certainty.
1. Separate sales, bookings and real attendance
Each figure answers a different question. Issued tickets show demand, confirmations show recent intent, and validated QR codes show actual presence. Keeping them separate prevents overstaffing or releasing places too early.
Paid tickets, free tickets and invitations
Confirmed and pending bookings
Cancellations, changes and transfers
Scans by gate and time slot
2. Build a baseline from comparable events
History is most useful when compared by event type, day, time, price and channel. A free morning session will not behave like a paid evening concert, even if both reach their booking limit.
3. Refresh the forecast before doors open
Reminders, ticket views and optional confirmations provide recent signals. The forecast can use cautious, expected and maximum scenarios so decisions do not depend on one no-show percentage.
| Data | What it indicates | Possible decision |
|---|---|---|
| Tickets issued | Recorded demand | Inventory and capacity |
| Confirmations | Recent intent | Staff and services |
| Historic arrival time | Expected peaks | Gates and scanners |
| QR scans | Real attendance | Live adjustments |
4. Size entrances and support
The expected arrival curve helps decide how many scanners, lanes and issue desks to open in each period. It also supports planning for security, ushers, transport, bars and kiosks.
5. Correct operations during the event
Once entry begins, scans progressively replace the forecast with real data. If one gate receives more arrivals or a zone remains quieter than expected, teams can be reassigned and alternatives communicated.
6. Handle no-shows with clear rules
For activities with a waiting list, any release must follow a published cut-off time and policy. The system should never invalidate a valid ticket simply because a model predicts its holder will not attend.
7. Learn after every session
Comparing the forecast with final scans improves assumptions by channel, price and audience. Woolando connects sales, bookings and QR access control to turn everyday activity into more accurate planning and a smoother experience.